Streaming is fun. There’s a reason why Twitch is bringing in 3 million active creators on its platform alone, per month. Among that group, there are individuals who stream for a hobby, some that are streaming to make it their job, and those that earn a living specifically off of Twitch. Whether you are new to the game or a seasoned streaming veteran, knowing how your channel is performing is key to improvement and overall growth on the platform. It is critical that you learn what is and isn’t working on your channel so you can be constantly improving your delivery and craft.
To do this, you need to be looking at your Channel Insights. If you check this data regularly, you are in a great spot. However, if this is the first time you are learning about this, you are missing out on some insane information that can help you grow on Twitch. Today, we are going to go over the Channel Insights on Twitch, what makes up the Channel Insights, how to use the data provided, and how achievements are a good way to stay active and working toward your goals. Let’s get into it!
Channel Insights
Channel Insights is the section of your Creator Dashboard that houses all of the channel specific information and analytics. To access Channel Insights, you need to do the following:
- Go to Twitch.tv
- Select your icon on the top right
- Select Creator Dashboard
- The Insights tab is on the left sidebar.
The Channel Insights section is broken into three different subsections:
- Channel Analytics
- Stream Summary
- Achievements
Each of these subsections provide detailed information about certain items of your channel. You can use these subsections to see how your channel performed over a month period or even how a specific stream went.
We do want to preface the following in regards to data and overall success on the platform: When viewing your channel analytics, we do recommend using the data, but not getting lost in the data. Especially as a new creator, it can be easy to see no growth and get discouraged. It doesn’t mean that you aren’t doing the right things, but the data would come off in that way. It is very easy to get lost in the data and how well your channel is or isn’t performing.
On your best days, the data will be great and you can tell that the changes and ideas you are bringing to the table are working. However, during the bad times, the data can bring you down and cause burn out. Use the data to help improve and grow your content. Don’t get lost in it.
Channel Analytics
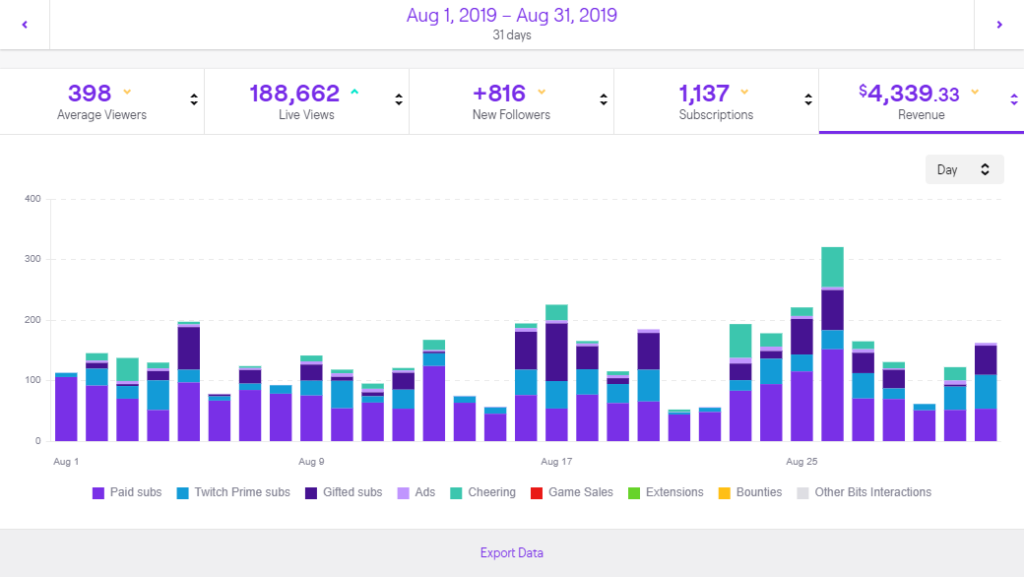
The Channel Analytics section provides a wholistic view into your channel. You can see items like:
- Average viewership
- Live views,
- Follower Gains
- Subscription Gains
- Revenue
This section provides an at-a-glance look at your channel over all of the streams you have done during a specific time period. You also get breakdowns into where your revenue is coming from, where your views are coming from, your top clips, and much more. This is very good for gauging your revenue streams and where you are driving people from to view your content on Twitch.
The amount of detailed information on the Channel Analytics page is impressive. You can break all of the data down by date ranges and use the analytics to see how new changes affected your growth over a specific period of time. The sheer amount of data that is present can be a little overwhelming. We recommend you use the Channel Analytics page to get an overall month-to-month comparison on how you are doing and to track specific actions you’ve taken on your channel.
For example, if you wanted to see how a new call to action was performing to push Prime Gaming subscriptions, you can see how many more Prime Gaming subscriptions you received during a time period when you implemented the CTA. Or if you decided to shift game genres, you can see how your average viewers and follower gains were affected and make a decision on how to proceed forward from there.
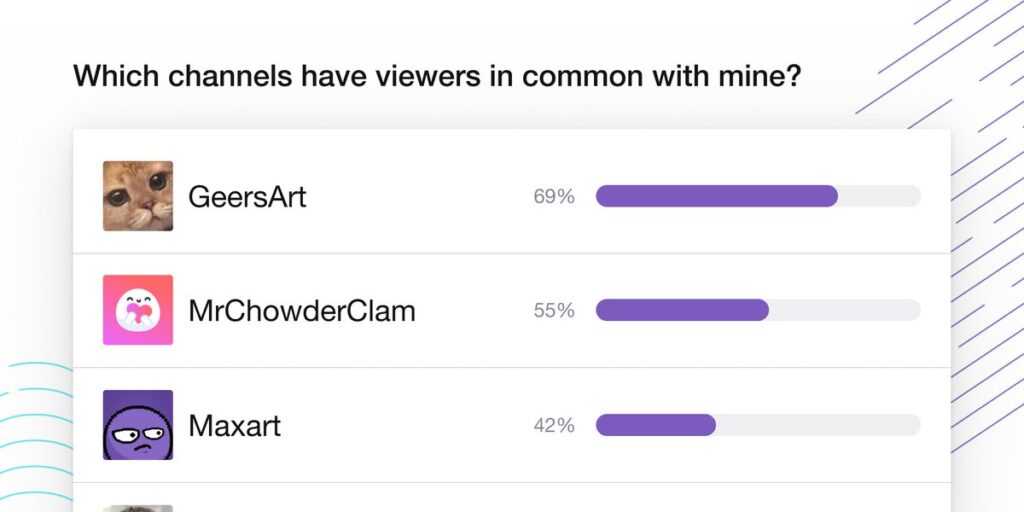
Another great tool in this section is the “Which channels have viewers in common with mine?” area. Ever wonder potential streamers you can collaborate with? This section is great to identify other channels that you share viewer interests with, but also give you an idea of people that you can collaborate with. If you find someone that has similar viewers and concurrents like you, they might be a good channel to look at and see if there are collaboration opportunities. You can create a plan to grow together and cross-pollinate your communities. All of this can be found in your Channel Analytics page.
Stream Summary
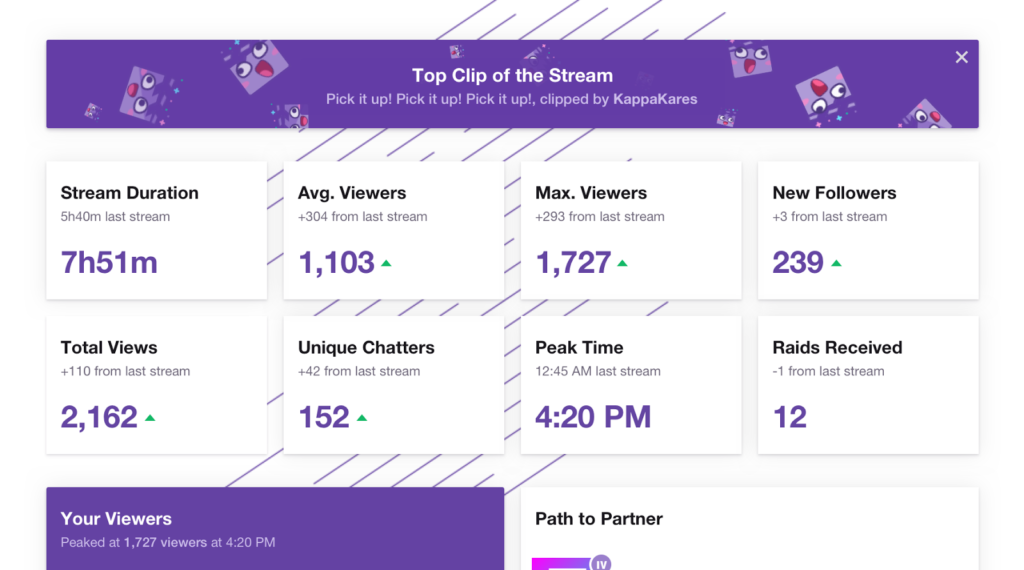
Stream Summary provides a detailed look at each of your previous streams. However, unlike Channel Analytics that focuses on an overall view of your channel, Stream Summary focuses specifically on the data related to your last streams. You will be able to see:
- Stream Duration
- Average Viewers
- Max Viewers
- New Follower Count
- Total Views
- Unique Chatters
- Peak Time
- Raids Received
- Viewers by Hour Chart
- Tips
- Views by Source
Why are these important? Well, the data literally provides a picture of the past streams and tells you how effective they were at helping you reach your goals.
For example, say you have a goal of 100 followers and you want to see how a new game helps get you to that goal. On Day 1, you stream Call of Duty. On Day 2, you stream Rogue Company. You can then go to Stream Summary and look at the numbers and see which one led to more followers, concurrents, subscriptions, and more.
You can also use this data to find your best streaming times. Say you stream Monday through Friday from 7:00pm to 10:00pm. You’ve been streaming for about 3 months and have a lot of data available to look at. You go to your Stream Summary and see that on average, your peak time for concurrents falls at 9:00pm and that until around 8:30pm, you aren’t really pulling individuals into the stream. But after 9:00pm, you are easily ending the night with double or triple the concurrents you had from the start. Well, you could then test to see if you started stream around 8:30pm and went until 11:30pm, how it affected your follower gain, concurrents, and overall reception. Does it result in higher viewership into the night? Does it provide a boost in followers? These are questions you can answer with this data.
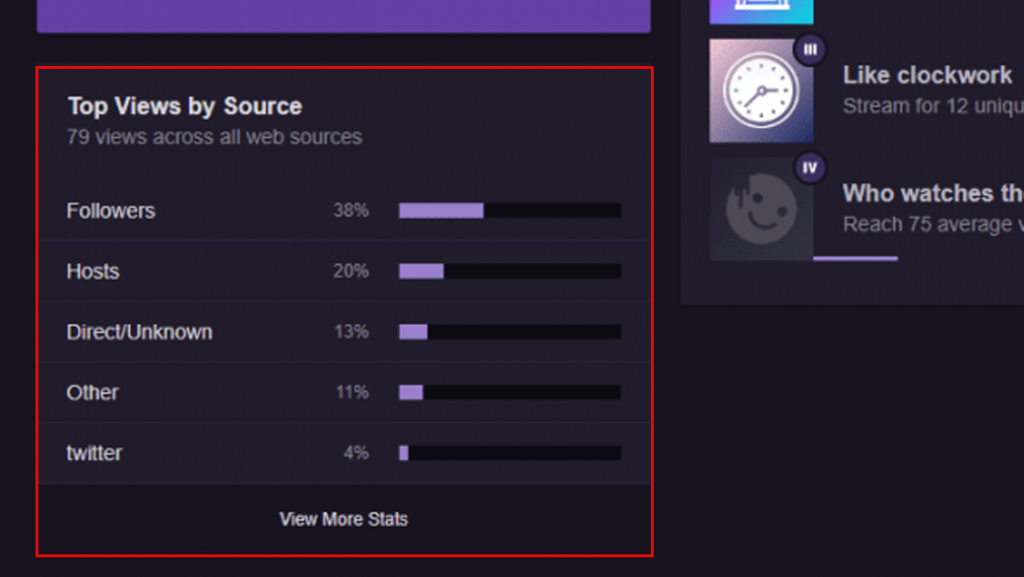
Another way to use Stream Summary to improve is to check your Views by Source box. This area shows where you are getting traffic to your channel. You can track to see how effective you are in bringing people from different platforms from Twitch. Use this to track the effectiveness of your CTAs on Twitter and Instagram. It will help you know if the CTA you are displaying on those platforms is working or if it is not converting.
Achievements
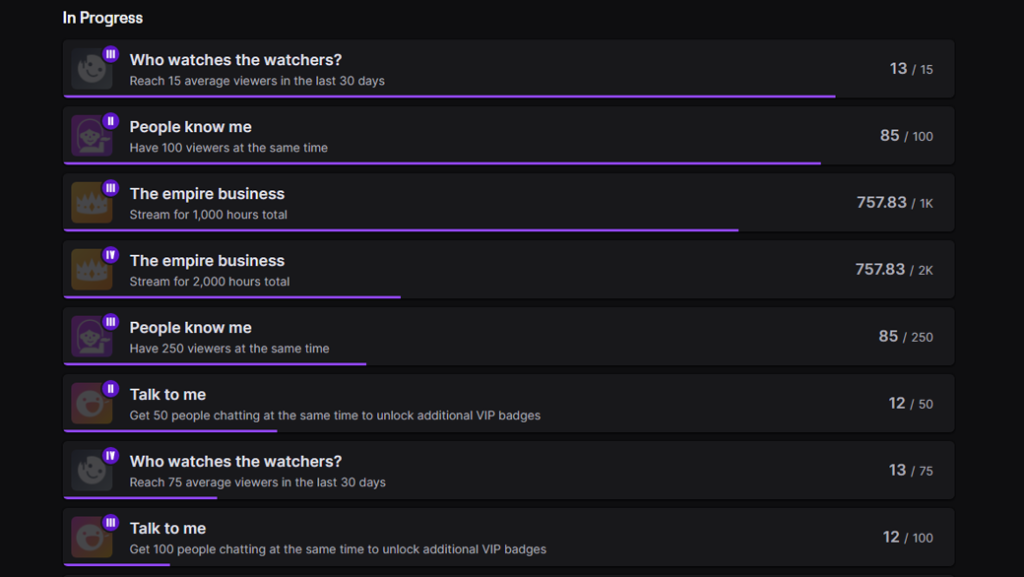
Achievements tracks channel milestones that you want to keep track of. Things like streaming for 2000 hours or reaching an average of 15 viewers over a 30 day period are nice goals to work toward. Achievements make it is easy to track this. While they are not necessarily used to track day-to-day changes on your channel, they can be used to track goals. Especially if Twitch Partnership is a goal of yours, you’ll want to keep an eye on Achievements. Instead of having people flood the application form for Twitch Partnership, Twitch provided an easy-to-follow guide on what they are looking for. Once you hit those Achievements, the form opens up for you to apply and potentially get selected.
Achievements also provides goals to work toward, which reduce fatigue and burn out. Its much easier to grind when you are actively working toward a goal in mind than to just mindlessly go live with no clear motives. You can use the Achievements in conjunction with Stream Summary and Channel Analytics to improve and change your content. By making those changes, you can then use the Achievements to track those goals visually. Each subsection plays into the other in the different ways that you use them.
Learning the ins-and-outs of Analytics can be a struggle, but its worth it if growth is a goal for you. If you aren’t looking at what is working and what isn’t, you’ll never know what content is resonating with the community. You could be doing something that is actively turning away your viewers and not even know it because you aren’t checking the numbers. You could also be thinking something you are doing is dumb, but its helping convert 50% more viewers. It all comes down to the numbers and we encourage you to take time out each week to go over them. If you have any analytics tips that we didn’t cover, make sure to leave it in the comments below! We would love to include it here for our interested readers!
As always, keep on creating and GLHF!